Comparing the algorithmic results of Stage A versus Stage B in the black box of social media games shows some diverging results.
While most of the content testing was similar, I did add some text replies to other players in Stage B and also reacted to a comment on Stage A. These may have affected the outcomes somewhat but I’ll assume they aren’t substantial for this analysis.
In terms of the responses, here are the results after a few days:
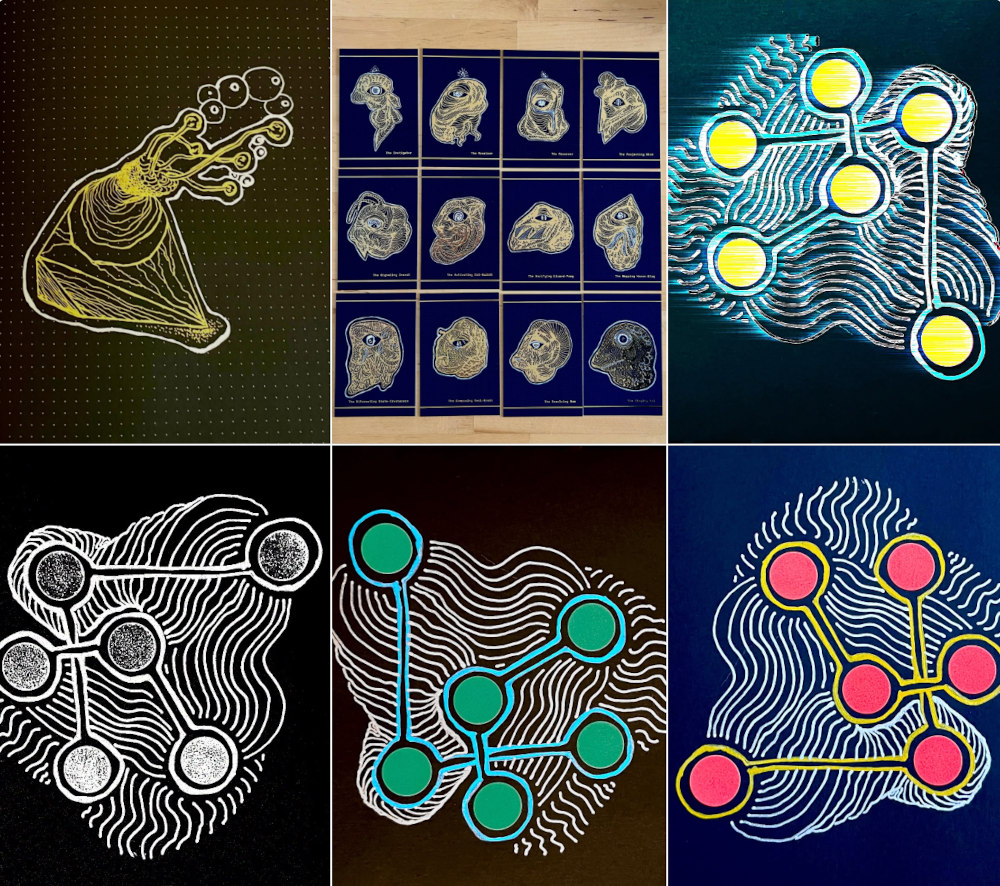
For the content, we separate them by their production format, where variants of the same photo art are considered ‘digital art’ if they are manipulated in a graphics editor and considered ‘photo art’ otherwise. Line complexity refers to how detailed or complex the lines in the artwork are and saturation level is how eye-catching the colors are.
| Content Id | Format | Line Complexity | Saturation Level |
|---|---|---|---|
| 1 | haiku, photo art | mid | high |
| 2 | haiku, digital art | mid | mid |
| 3 | haiku, digital art | mid | low |
| 4 | haiku, digital art | mid | low |
| 5 | photo art | high | mid |
| 6 | photo art | high | mid |
Stage A Results:
| Content | Views | Interactions |
|---|---|---|
| 1 | 8 | 0 |
| 2 | 6 | 1 |
| 3 | 4 | 0 |
| 4 | 2 | 0 |
| 5 | 6 | 1 |
| 6 | 3 | 1 |
Stage B Results:
| Content | Views | Interactions |
|---|---|---|
| 1 | 3 | 0 |
| 2 | 2 | 0 |
| 3 | 2 | 1 |
| 4 | 3 | 0 |
| 5 | 4 | 0 |
| 6 | 13 | 1 |
Content containing haikus with photo art appears to have feed bias in Stage A while Stage B prefers broadcasting photo art with no haikus or alterations. Both stages interacted with the final photo art, which makes me think that trying a high saturation photo art with complex lines has a greater likelihood of getting at least one interaction and at least a few views on both stages. Text with photo art doesn’t seem to matter much from these tests, so I will leave it out for the next round.
The next process is to generate at least three photo art illustrations with saturation and share them a few hours apart across the day. Will they have similar views and interactions? Or will the rules of the stage change upon observation?
Content in reverse order.